
Oct 14, 2026
- [Web Search for Browserbase is now powered by Parallel](https://parallel.ai/blog/browserbase-search-powered-by-parallel)
Tags:Product
Author: By ParallelJuly 30, 2026
Customer Watch is an always-on agent that monitors every Parallel account for usage spikes, errors, payment failures, and customer news, then posts into a Slack thread with the right account manager looped in. This post covers why we built it, the five pipelines it runs today, and the stack underneath: Pi, Hex, Attio, Slack, and our own Monitor and Task APIs.

When we first started testing our products in 2023, we approached customer support in a very "do things that don't scale" way, by manually monitoring usage and reaching out to customers one-on-one. This hands-on approach taught us a lot about our users, their needs, and our own products. As we've scaled, we want to maintain this ethos.
With AI, it's possible to do things that didn't used to scale. That's why we built Customer Watch, an always-on agent that continuously monitors customer signals, enabling us to provide proactive customer support. With Customer Watch, we can help customers use our products better, fix bugs, and seize sales opportunities that would otherwise go unaddressed.
Back when we had fewer than 100 customers (and before Customer Watch), we spent a lot of time monitoring customer sign-ups and deciding whether to reach out to them and offer product support. With Hex[Hex], our data visualization tool of choice, we could see usage rise and fall and make relatively informed decisions.
Because we offer seven different API products with usage-based, pay-as-you-go pricing, as well as supporting sales-led and product-led growth (PLG) customers, we needed to understand our users and their usage at granular levels. Usage going up could signal potential for expansion; usage going down could indicate a bug we could fix.
This work was helpful but manual, reactive, and ultimately unscalable. Inevitably, many signals were lost. For example, if a self-serve developer spent $5 one week and then suddenly spent $100 the next week, we might miss it because the absolute numbers are low. But that shift in spending is a strong signal of deeper usage, potential expansion, and useful feedback.
We didn't like being in such a reactive position, and we especially didn't like missing critical insights. That's what led us to build Customer Watch.
With Customer Watch, anyone on the Parallel GTM team can describe, in natural language, what they'd like to be alerted to. Customer Watch takes those requests, converts them into a list of thresholds to check, and monitors those thresholds on an ongoing basis. When those thresholds are met (e.g., usage above a predetermined amount), the system notifies our team via dedicated Slack threads, looping in the relevant account managers.
While the tool is general-purpose, our team is using it in a few specific use cases:
Customer Watch provides each account manager with a feed that includes all the customers in their portfolio. For each account, we include thresholds reached (e.g., API usage), issues identified, product mix changes, and news in the customer's industry.
**Pi**[**Pi**] is a minimal agent harness that stands out from other options for its adaptability and customizability. Pi lives in the cloud, and you can set rules for it and instruct it to self-improve, which gives us a relatively lightweight way to iterate on it over time. When a Customer Watch background run starts, it spawns a Pi instance with a per-account session file and a global system prompt. We pin the model to `claude-sonnet-4-6` and scope the working directory to a limited repo, so it can't reach anywhere it shouldn't.
**Hex** is our analytics warehouse and data connector, and we use it to visualize and analyze data. Every Hex call goes through `scripts/hex.sh`, which exposes:
`ask`, which opens a thread for a named project`result`, which polls for task completion`auth-refresh`, which rotates the OAuth token**Attio**[**Attio**] is our CRM, and it's our primary source of customer information. Using the Attio API, agents can pull context about account details and deal status.
**Slack** is the primary way we communicate as a team, making it the natural delivery surface and point of interaction for Customer Watch. A Socket Mode listener handles intake and detection. A thin `slack.sh` wrapper handles outbound posts and threaded replies.
We used Parallel to build Customer Watch because it's the best way to build this use case (i.e., no one is forcing us to dogfood it). We use two Parallel APIs to make this happen: Parallel Monitor and Parallel Task.
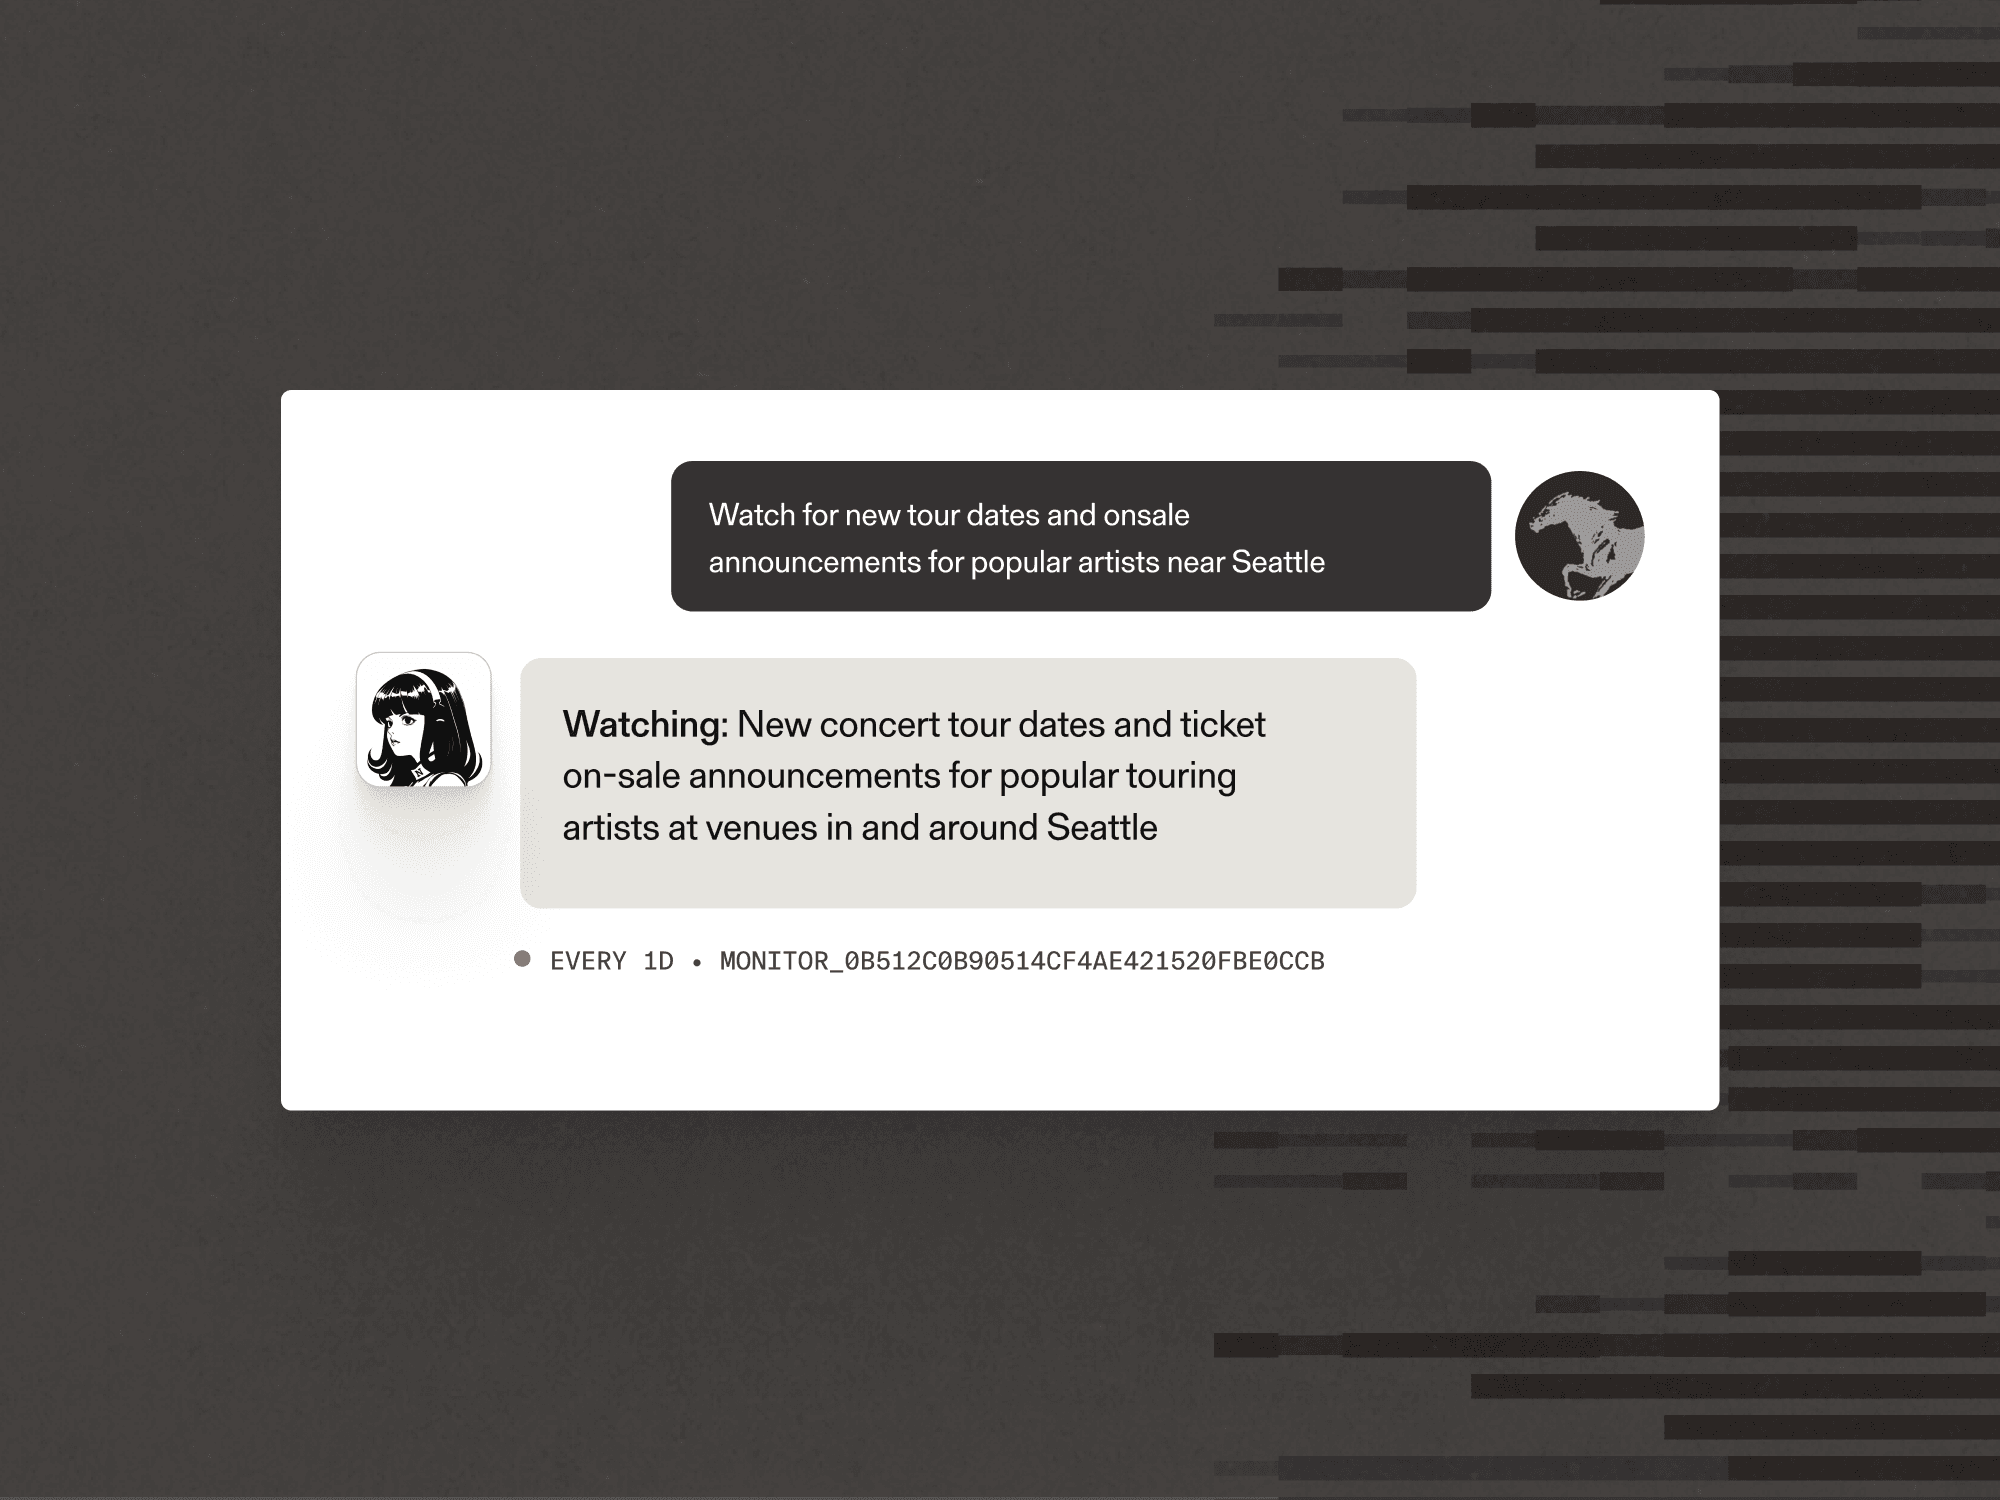
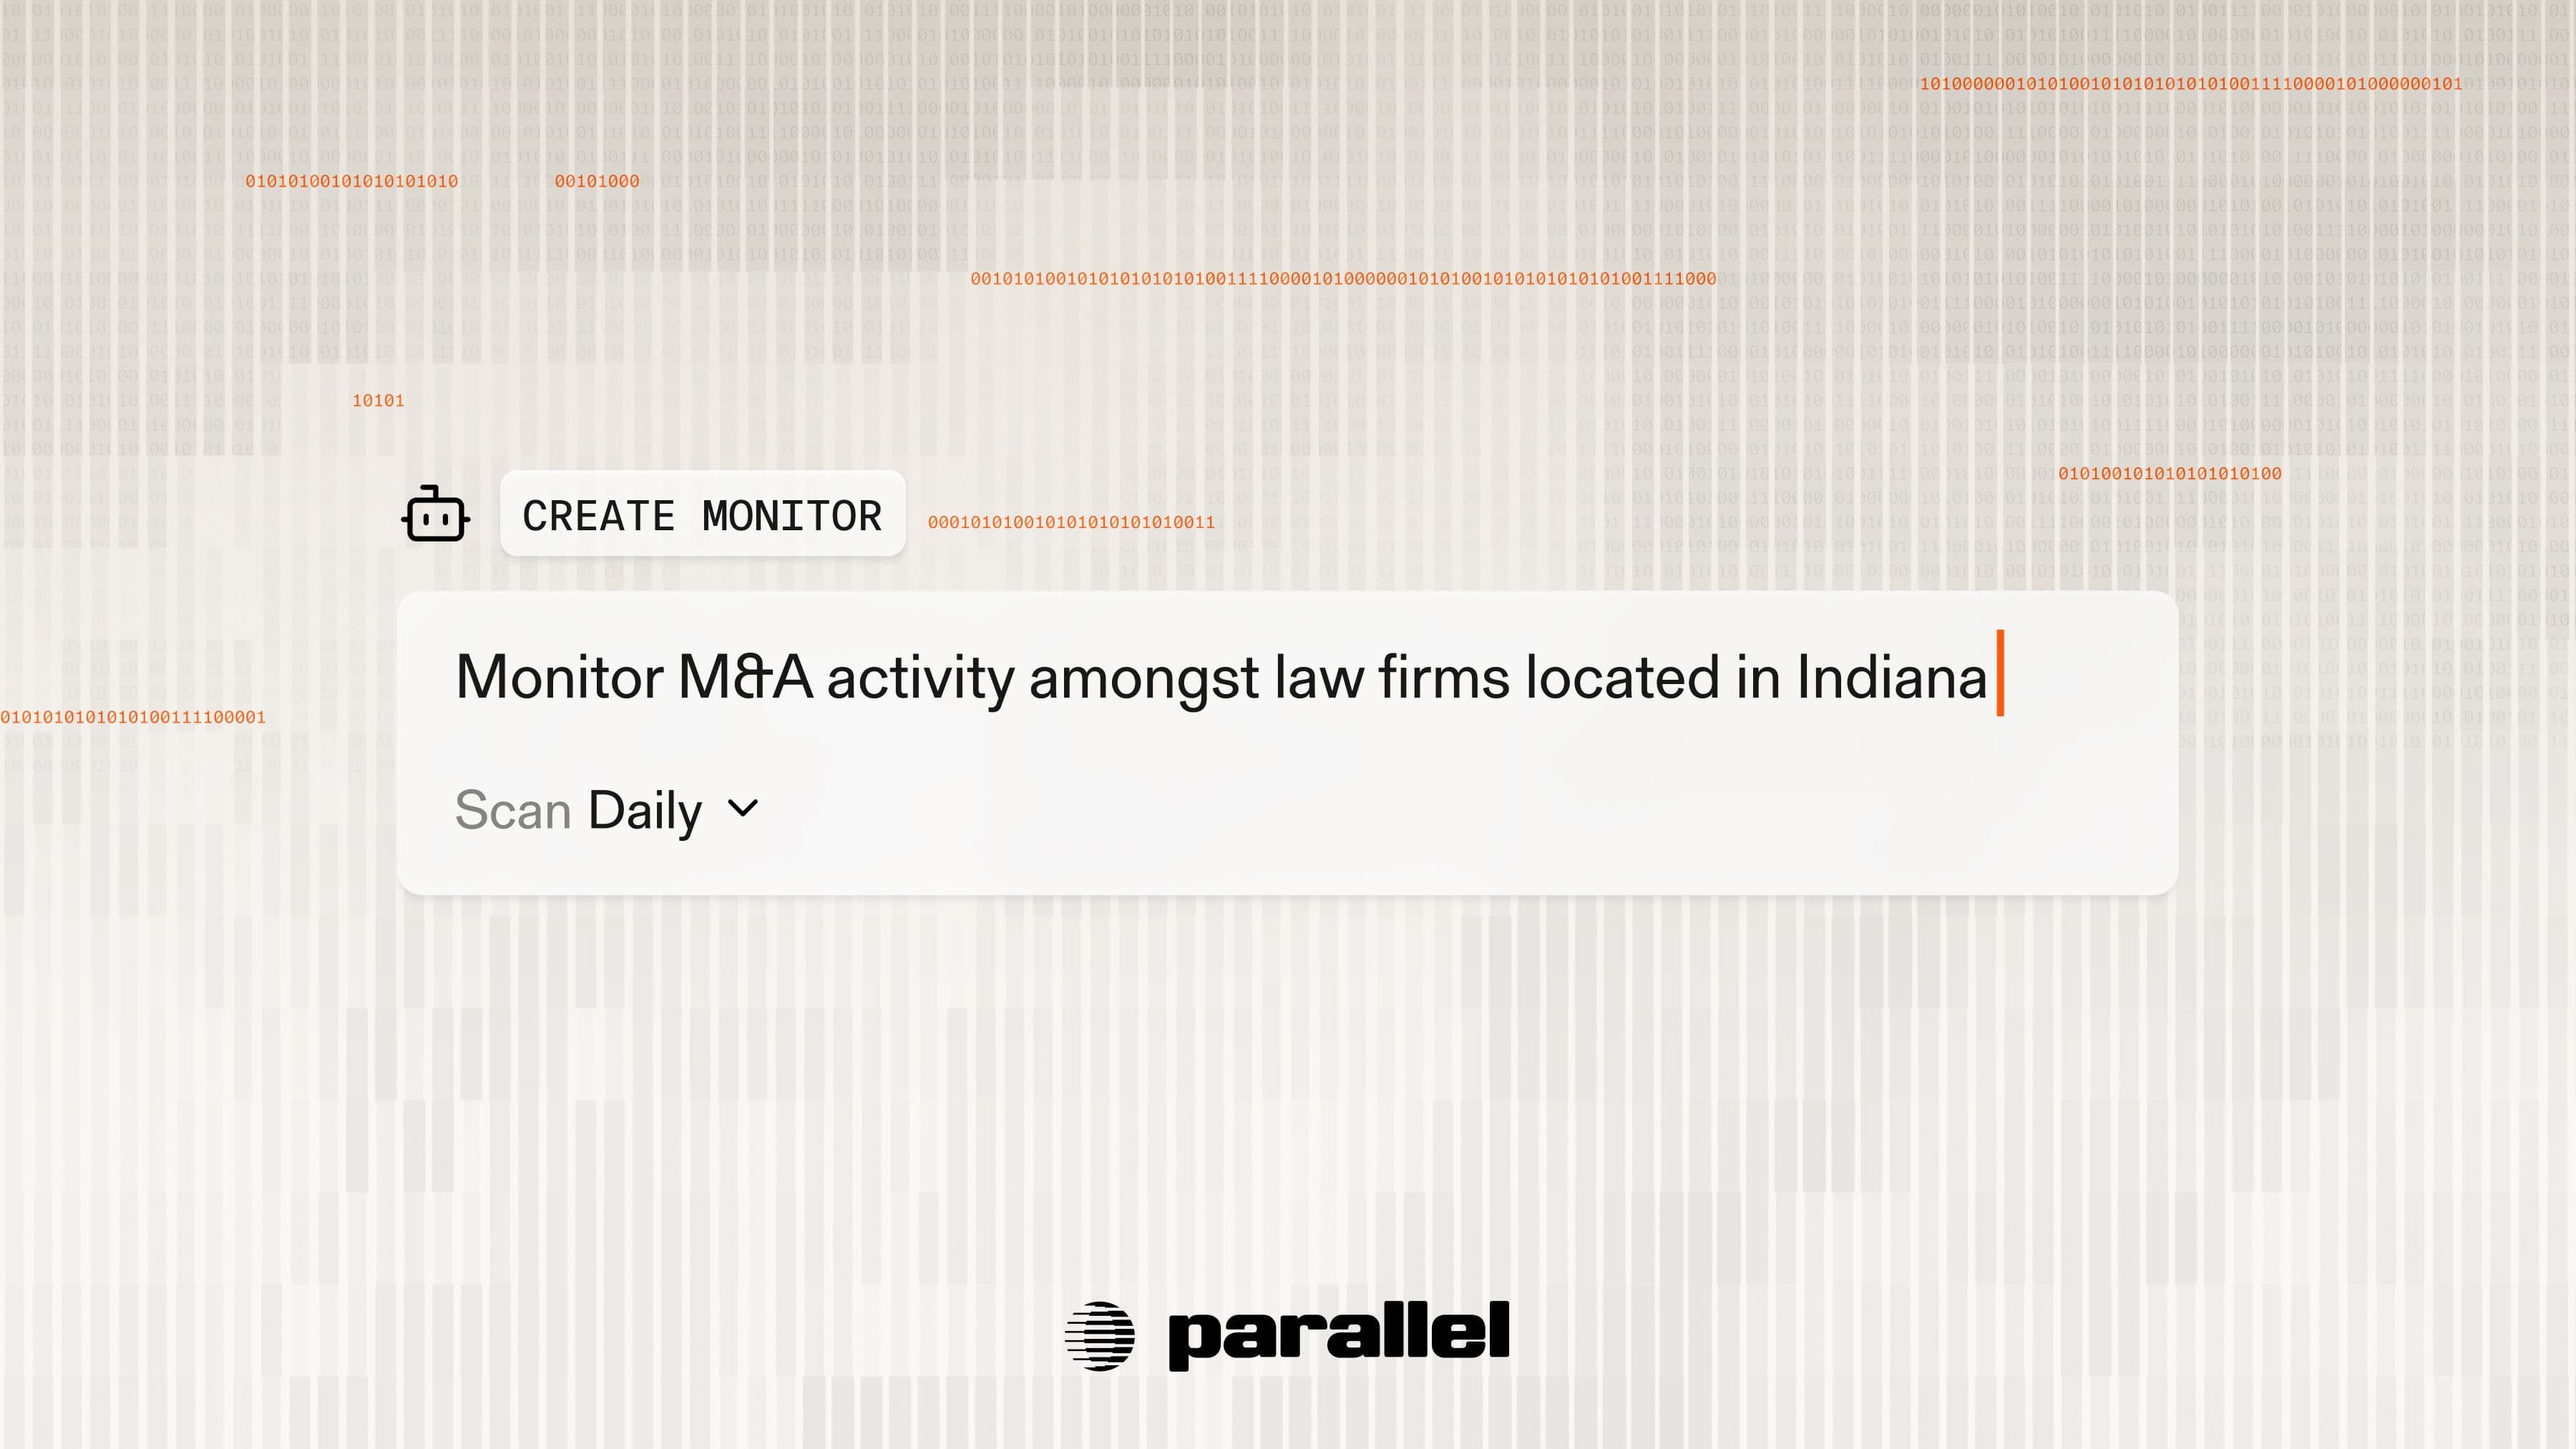
The Parallel Monitor API[Parallel Monitor API] runs always-on web searches that notify users when new results are available. Here, we use it to power the natural-language layer of Customer Watch. Account managers describe what they want to know about a customer in plain English, and the Monitor API handles the conversion from natural language into daily checks.
The Parallel Task API[Parallel Task API] turns manual workflows into repeatable, programmable operations powered by AI web search. Here, we use it to run weekly summaries that call tasks, run queries such as "What has happened at {Account}…", and parse the results into text outputs. With Parallel's deep research and enrichment capabilities, the Task API can scour the web for even the most granular news and return it as concise, useful summaries, including hyperlinked citations.
The system architecture comprises six layers, leading from Slack and cron triggers to dispatch Pi, which triggers one of our prompts, each integrating with different tools before reaching a range of endpoints.
The only infrastructure required is a cron table and a long-lived Node process to keep the agent running in the background. We lock the tool layer to four wrappers (`hex.sh`, `task.sh`, `slack.sh`, and `attio`), ensuring agents don't go where they shouldn't. As the workflow completes, the system writes to files first and foremost to maintain file histories. Then, the files are output to Slack, where our account managers read and act on them.
In the dispatch layer, which is universal across all our use cases, `run-agent.sh` takes an account slug and a prompt type, adds variables such as `{DATE}`, `{ACCOUNT_SLUG}`, and `{WATCH_PATH}` into the prompt template, and spawns Pi with the correct session file and timeout.
Every prompt writes to history at the end of the run, even when nothing was found. This ensures the agent can read from its previous context, allowing it to remain always on without using compute to restart from scratch with every prompt. The history file template is also identical across prompts, which lets the next run know what was already flagged and what's still being watched.
For the relevant accounts, we have a prompt (`daily-monitor.md`) that runs daily at 9 am PT. The `daily-monitor.md` prompt asks Hex a single question that covers everything, including error counts, rate limits, validation, payment, server, usage today compared to the same day the prior week, and latency per product.
Our one-question-per-run rule is strict because it keeps warehouse costs predictable and makes the Hex thread a useful debugging artifact. It also acts as a forcing function, ensuring our prompt authors think through what they want up front rather than adding numerous ad hoc lookups after the fact.
Once the agent has the question answered by Hex, it compares the result against several custom thresholds, with natural language descriptions mapped to those thresholds.
For weekly reporting use cases, including monitoring industry and company news, `weekly-summary.sh` runs the same dispatch loop as the daily monitor, but with more prompt work. The prompt asks Hex for a weekly health view (including spend, product mix, commit pacing, errors, and latency), then calls Parallel's Task API with a single, time-anchored question, such as:
12345./scripts/task.sh run "What has happened at {Account} in the past
  week as of {DATE}? Looking for: product launches, funding,
  acquisitions, executive changes, AI strategy shifts, layoffs,
  or major partnerships. Ignore routine press releases, awards,
  and content marketing."``` ./scripts/task.sh run "What has happened at {Account} in the past  week as of {DATE}? Looking for: product launches, funding,  acquisitions, executive changes, AI strategy shifts, layoffs,  or major partnerships. Ignore routine press releases, awards,  and content marketing."```
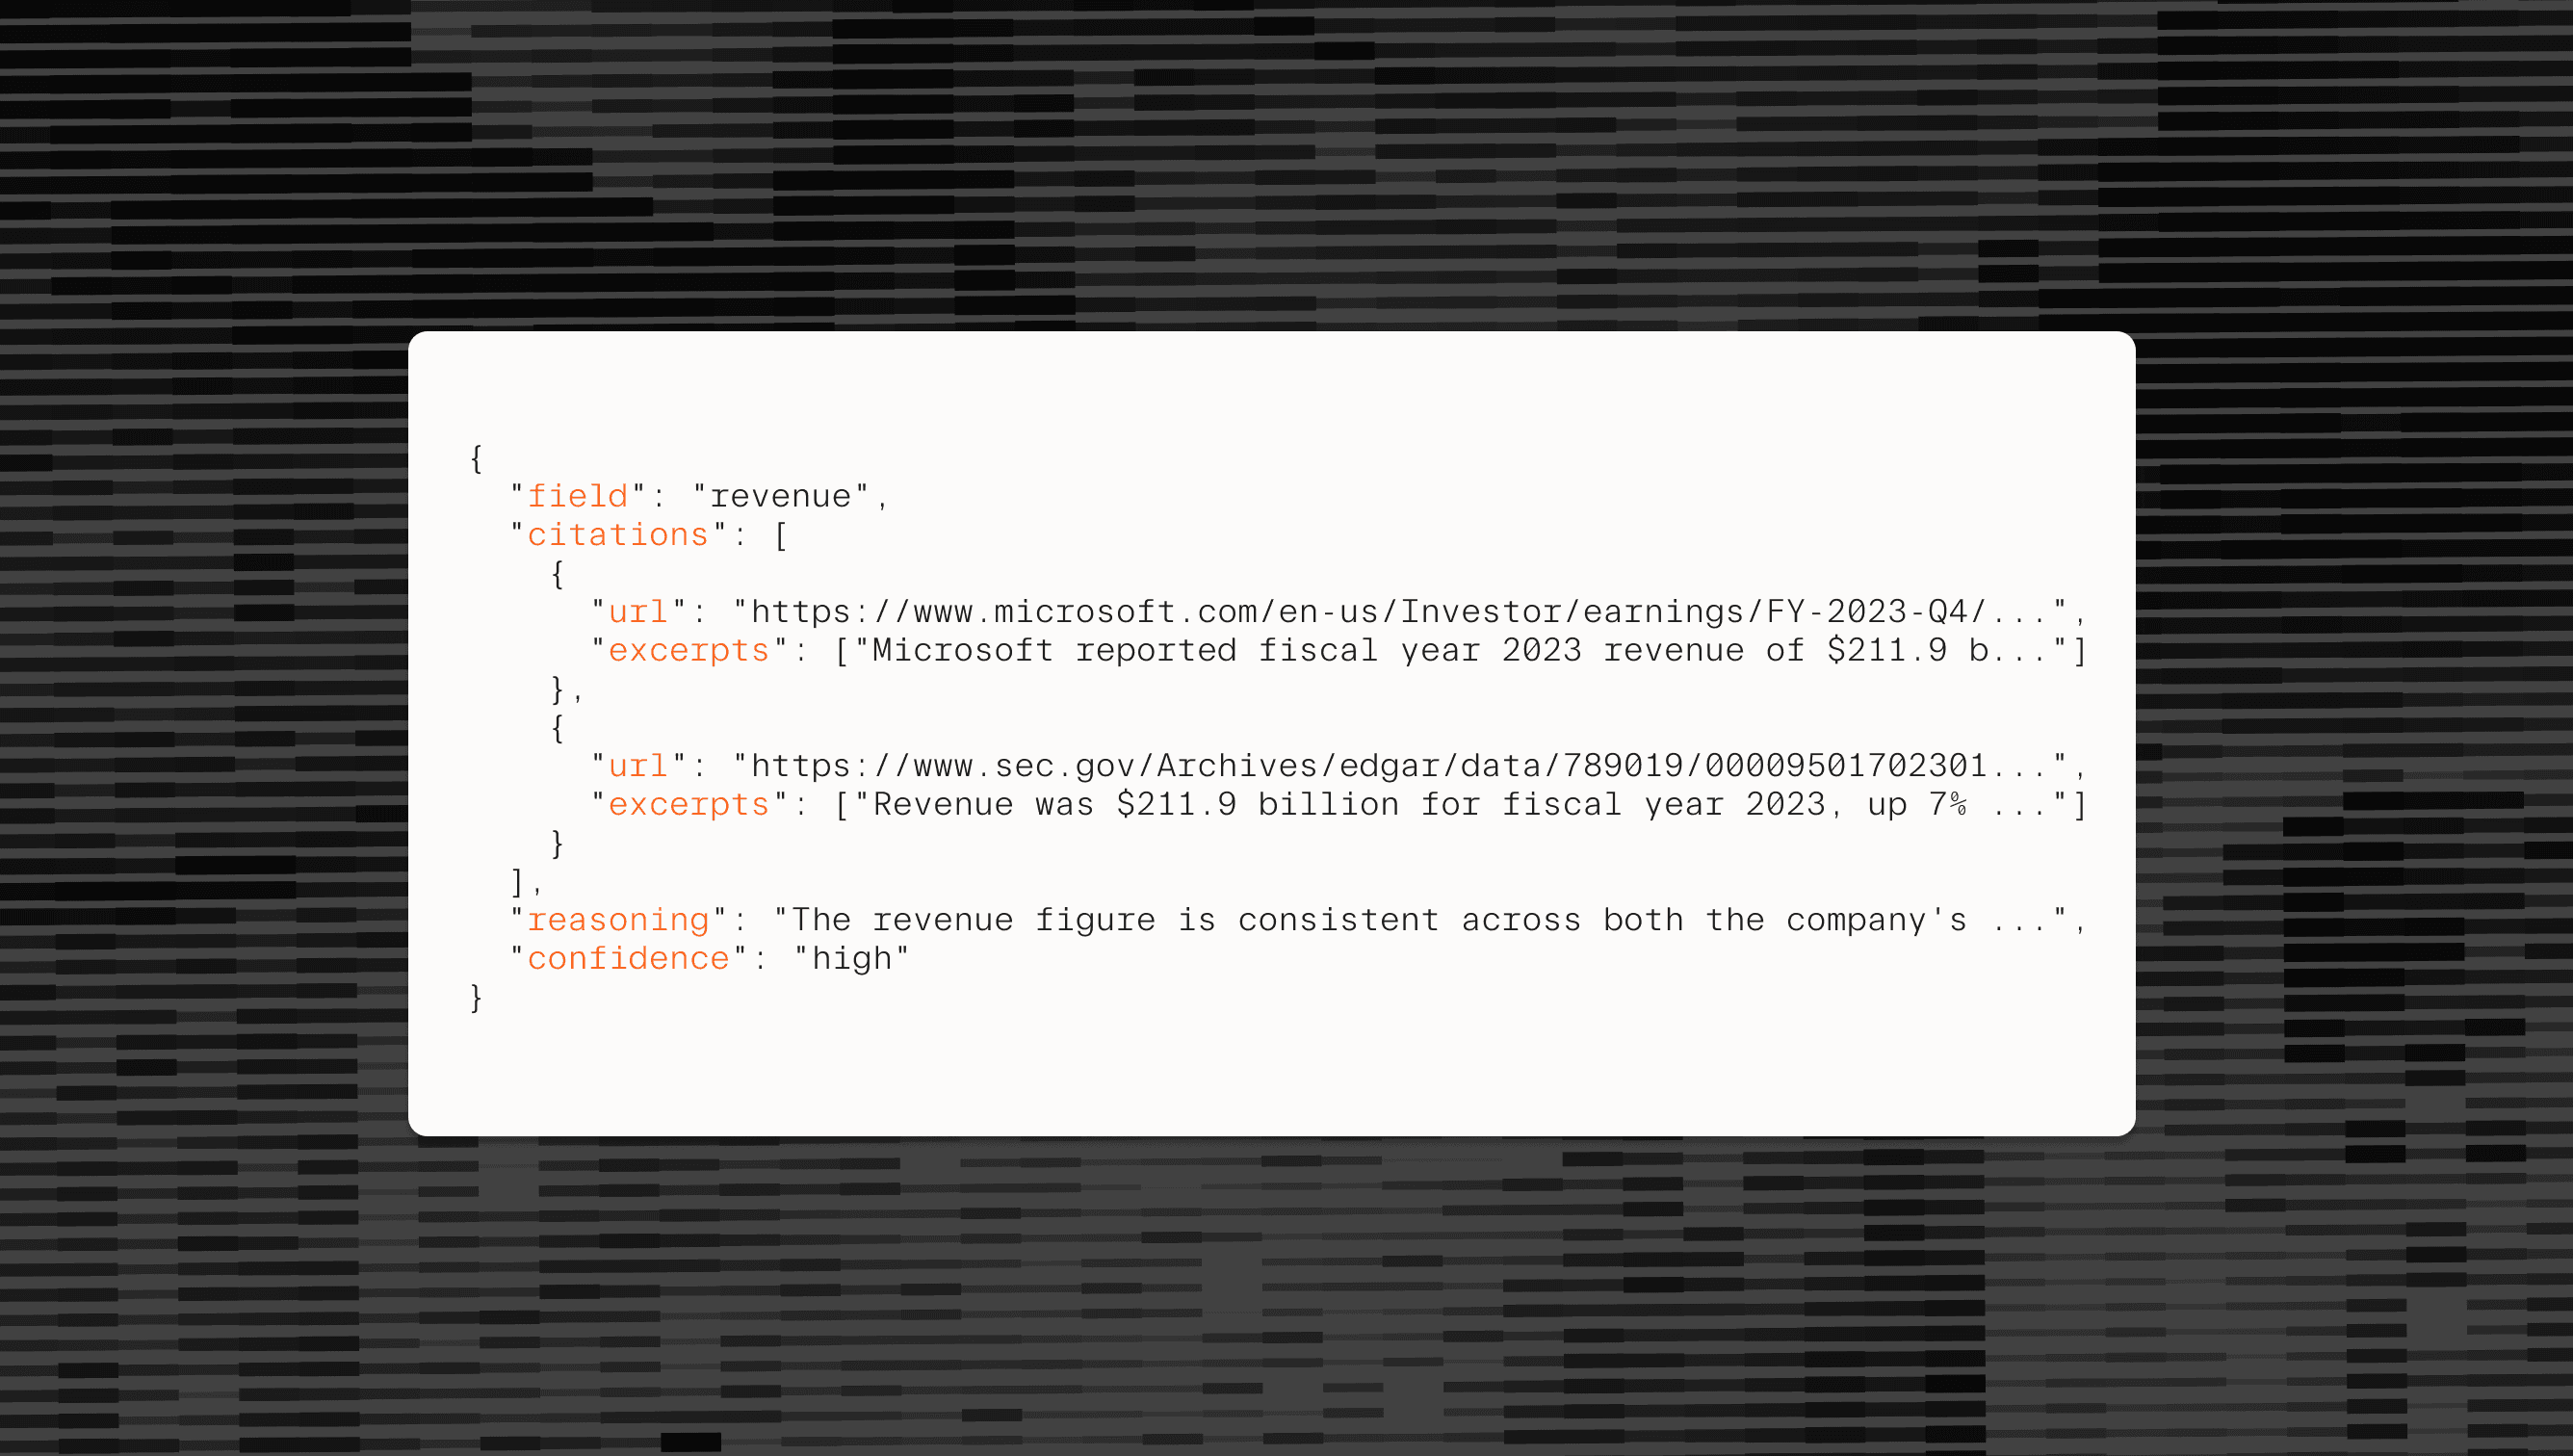
The Task API returns structured output we can parse without re-prompting an LLM:
1234567891011{
  "output": { "text": "..." },
  "basis": [
    {
      "field": "text",
      "citations": [
        { "url": "...", "excerpts": ["relevant passage"] }
      ]
    }
  ]
}``` {  "output": { "text": "..." },  "basis": [    {      "field": "text",      "citations": [        { "url": "...", "excerpts": ["relevant passage"] }      ]    }  ]}```
The agent reads `output.text` for the findings and `basis[].citations` for the source URLs, then matches each finding to its citation and emits Slack-compatible hyperlinks. This ensures every news bullet in the weekly digest is a sourced claim rather than a paraphrased statement.
Intake runs through a Slack listener, which waits for any @mention of the bot and routes questions to the intake flow. The runner (which runs at 9:15 am PT on weekdays) evaluates each active watch with a single Hex query, applies the class-specific decision rule, and posts to Slack.
When a request comes in, the intake agent parses messages from our team members, classifies the question, identifies the account they're referring to, and writes a configuration to monitor for matching information. If anything is ambiguous, the agent asks one clarifying question in-thread and waits for an answer. The next reply in the same thread returns to the same intake flow, with the existing configuration already set.
We've found that almost every natural-language question falls into one of three types, as shown below:
| Class | What the runner does |
|---|---|
| window-24h | Aggregate a metric over the last 24 hours and compare it to a stated threshold |
| state-first-ever | Check whether an event happened in the last 24 hours, and confirm that it has never happened before |
| state-new-mix | Compare the set of products/endpoints called in the last 24 hours to the historical set |
So we've optimized the runner by adding specific logic to handle each query type, rather than having it handle each query from scratch. As a result, this workflow requires very little logic for each new task. Once the intake correctly classifies the task, the runner already knows what type of Hex query to write and what type of comparison to make. Adding new query types only requires a table edit and a couple of new branches.
The pipeline that supports our PLG use cases, unlike the other use cases, doesn't use the Pi agent at all. Instead, it uses four Python steps, chained by `run_plg_v2.sh`, to pull PLG signals from Hex weekly, deduplicate and clean them, and enrich the candidate list using the Parallel Task API, which fills in funding, sector, and AI-strategy context.
Each Friday, the pipeline submits a few hundred companies in one batch. Every run is pinned to a structured JSON schema, so the output is queryable by column rather than scraped from text.
12345678910111213141516171819202122232425262728293031from parallel import Parallel
from parallel.types import TaskSpecParam, JsonSchemaParam

OUTPUT_SCHEMA = {
    "type": "object",
    "required": ["one_liner", "industry", "company_type",
                 "employee_range", "funding_stage", "likely_use_case"],
    "properties": {
        "one_liner":         {"type": "string"},
        "industry":          {"type": "string"},
        "company_type":      {"type": "string", "enum": [...]},
        "employee_range":    {"type": "string", "enum": [...]},
        "funding_stage":     {"type": "string", "enum": [...]},
        "likely_use_case":   {"type": "string"}
    },
}

client    = Parallel()
task_spec = TaskSpecParam(
    output_schema=JsonSchemaParam(type="json", json_schema=OUTPUT_SCHEMA)
)

tg = client.beta.task_group.create()
client.beta.task_group.add_runs(
    tg.task_group_id,
    default_task_spec=task_spec,
    inputs=[
        {"input": build_prompt(row), "processor": "core"}
        for row in chunk
    ],
)``` from parallel import Parallelfrom parallel.types import TaskSpecParam, JsonSchemaParam OUTPUT_SCHEMA = {    "type": "object",    "required": ["one_liner", "industry", "company_type",                 "employee_range", "funding_stage", "likely_use_case"],    "properties": {        "one_liner":         {"type": "string"},        "industry":          {"type": "string"},        "company_type":      {"type": "string", "enum": [...]},        "employee_range":    {"type": "string", "enum": [...]},        "funding_stage":     {"type": "string", "enum": [...]},        "likely_use_case":   {"type": "string"}    },} client    = Parallel()task_spec = TaskSpecParam(    output_schema=JsonSchemaParam(type="json", json_schema=OUTPUT_SCHEMA)) tg = client.beta.task_group.create()client.beta.task_group.add_runs(    tg.task_group_id,    default_task_spec=task_spec,    inputs=[        {"input": build_prompt(row), "processor": "core"}        for row in chunk    ],)```
We use `task_group.create()` instead of one-by-one runs because hundreds of single Task runs can ratchet up coordination overhead. Using a single task group gives us a single ID to poll, a single set of run IDs to map back to companies, and a clean way to resume when the script is interrupted.
The polling loop checks `status.task_run_status_counts` every three seconds and breaks once `is_active` is false. Once the run finishes, the completed run state is appended to a JSONL file.
We intentionally keep this logic deterministic. PLG signals are noisy enough already, and we preferred the ranking logic to be easily legible and version-controlled, rather than have an agent negotiate them anew each Friday.
Customer Watch runs in production at Parallel today, helping us improve customer support and customer expansion.
Our long-term goal is to extend Customer Watch across the customer lifecycle, ensuring each stage of the journey is aided by agents. We've already taken the next step in that journey by launching an experimental version that monitors the web for product and sales signals to identify new prospects.
We're still pretty early in this journey and are always looking to learn from others. If you're building something similar and want to compare notes, reach out[reach out]!